
Why a High-Confidence Pick Can Still Lose: Understanding Probability and Variance
Understand why high-confidence betting picks still lose, how betting variance works, and why probability estimates do not guarantee individual outcomes.
Why a High-Confidence Pick Can Still Lose: Understanding Probability and Variance
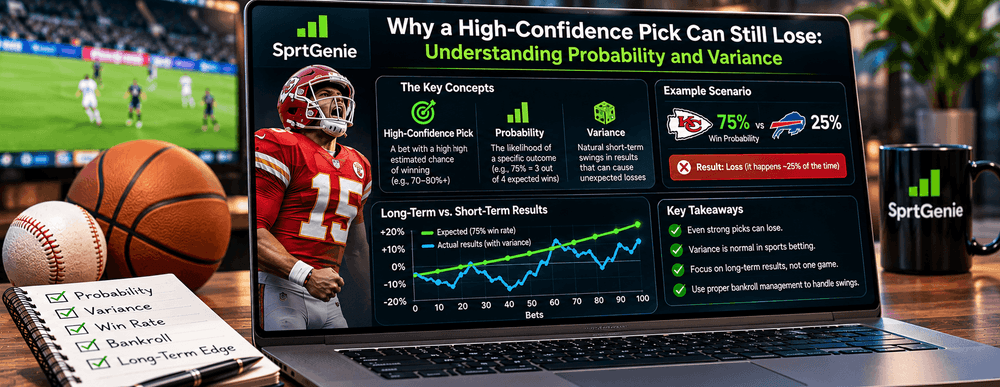
An 80% forecast still leaves a 20% chance that the outcome fails. That simple fact explains why high confidence betting picks can lose even when a well-calibrated model is operating as intended. Betting variance makes individual outcomes and short sequences noisy, while injuries, officiating, random events, and market prices add further uncertainty. Probability in sports betting describes a distribution of possible outcomes—not a schedule of guaranteed wins. This article distinguishes confidence labels from estimated win probability, explains why losing streaks are possible, and shows how to judge a model over meaningful samples rather than reacting to one winning or losing selection. It also separates the likelihood of winning from whether the price is attractive.
What a High-Confidence Pick Actually Means
Confidence Score Versus Win Probability
A confidence score may summarize model agreement, data completeness or perceived forecast strength; it is not necessarily the probability that the selection wins. Platforms may label the same score differently. Win probability is a separate numerical estimate, and positive expected value depends on that estimate relative to the price.
An 80% Chance Still Means a 20% Failure Chance
Imagine independent events with a well-calibrated 80% win probability. About one in five could fail on average, even though each event looks favorable. The expected frequency emerges across sufficiently many observations; it does not dictate that exactly eight of each sequence of ten must win.
Why Labels Depend on Model Design
'High', 'medium' and 'low' are reporting categories, not universal statistical standards. Without the provider's score definition and historical calibration, a green high-confidence badge cannot be safely interpreted as an 80%, 90% or any other chance of success.
Understanding Betting Variance and Losing Streaks
Variance in Individual Sporting Events
Sports outcomes contain unpredictable elements: turnovers, foul trouble, officiating decisions, late injuries and random variation. Models should capture known sources of uncertainty but cannot enumerate every possible sequence. Even the better forecast can lose through an unlikely but entirely legitimate result.
The Difference Between Short-Run and Long-Run Results
The average across hundreds of comparable events can be informative while a short run is volatile. Suppose ten unrelated events each have an 80% chance of winning. The expected number of wins is eight, yet seven, nine or even fewer wins are possible. Expected counts are not fixed quotas.
Correlated Selections and Risk Concentration
Multiple selections may share the same game script, player injury exposure or tactical conditions. Correlated outcomes undermine the assumption that each leg is independent. In parlays or clusters of player props, apparent diversification may be illusory and the combined risk can exceed a simple independence-based estimate.
Regression to the Mean and Selection Bias
Regression to the mean does not imply a gambler is 'due' for a win after losses. Selection bias can make a series look extraordinary when only one streak is highlighted. Evaluate the model's entire prediction population and avoid changing criteria only in response to the latest outcome.
Worked Example and Reference Tables
| Forecast | Implication | What it does not imply |
|---|---|---|
| 80% estimated chance | 20% chance of failure | 8 wins in every ten |
| High confidence label | Model-specific support | Guaranteed win |
| Positive estimated EV | Modeled favorable average | Certain profit |
| Negative result | One realized outcome | Model automatically wrong |
| Hypothetical chance | Offered odds | EV on $100 |
|---|---|---|
| 80% | -500 | -$4.00 |
| 80% | -300 | +$6.67 |
| 55% | +100 | +$10.00 |
Why Accurate Models Still Make Wrong Calls
Calibration Across Many Predictions
A calibrated 80% probability bin should have roughly 80% observed successes across a representative sufficiently large sample. Some failures are expected. Conversely, repeated failures far beyond the expected rate may point to model misspecification or data changes, though sampling variability must be considered.
Uncertainty From Injuries and News
Injuries and late-breaking news can invalidate an otherwise reasonable forecast. The dashboard may refer to earlier rosters or prices. Compare update timestamps and input quality before deciding that confidence should remain unchanged.
Probability Is Not the Same as Positive EV
A favorite can be very likely to win but still carry negative expected value if the price is too short. An 80% estimated chance at -500, for example, yields only $20 net per $100 win and costs $100 on a loss: EV = 0.8 × 20 − 0.2 × 100 = -$4. Probability and price are separate considerations.
How to Evaluate Confidence Responsibly
Ask What the Score Measures
Ask the platform how confidence is defined and how past forecasts in that category performed. Compare confidence labels with actual probability calibration rather than assuming 'high' means 'safe.' Note whether the model accounts for missing injury or lineup information.
Track Records, Sample Sizes and Market Prices
Public results are more informative when they include losing picks, original odds, sample sizes and segmented ROI. Track how forecasts compare with subsequent closing prices while keeping price performance separate from outcome prediction accuracy.
Set Decision Limits and Avoid Chasing Losses
Sports betting involves financial risk and is for adults 18+ where legal. Establish limits before considering any activity and do not increase stakes to recover losses. SprtGenie can support analysis, but neither a public track record nor a model confidence badge guarantees the next result.
A losing event is fully compatible with a reasonable probability forecast. Interpret confidence as a measured claim that can be tested across many outcomes, never as a promise.
Practical Case Study
For ten independent hypothetical events each assigned an 80% win probability, the expected total is eight successes. But the probability of exactly eight successes is a little over 30%, not 100%. The probability of at least one loss across all ten is 1−0.8^10, or about 89.26%. Thus one or more failures are not surprising even when all ten forecasts are well calibrated. Independence is an assumption of this illustration, not a general fact about sports selections.
For parlays sharing a team, game or athlete, the outcomes may be correlated; an injury could simultaneously affect several legs. Forecast confidence can also be stale if team news changes after a prediction. Review the actual model definition, the frequency of successes for forecasts in each band, and the original prices. An 80% chance at -500 could still be negative EV as shown earlier. A calmer interpretation of losing streaks avoids the mistaken belief that a win is due and the financial harm of chasing outcomes.
FAQ:
1. Why do high confidence betting picks lose?
High confidence betting picks lose because model confidence and event certainty are not the same. Even an 80% chance includes a 20% failure possibility. Confidence labels may also summarize data quality or model agreement rather than a calibrated win probability.
2. What is betting variance?
Betting variance is the fluctuation in realized results around their expected long-run frequencies or returns. Unpredictable on-field events, sampling noise and payout differences contribute. A short losing sequence is possible even with reasonable estimates and does not by itself establish model failure.
3. Does 80% probability mean 8 wins in every 10 events?
No. An 80% probability represents an average tendency across many comparable independent events, not a fixed schedule. Any particular set of ten can contain more or fewer than eight wins. Sample size and independence matter when interpreting observations.
4. How is confidence different from win probability?
Win probability estimates the chance of an outcome. Confidence may measure how strongly the model supports a forecast or how reliable its data seem. Unless the provider defines the confidence scale and validates it historically, the two numbers should not be treated as identical.
5. Can high-confidence selections have negative EV?
Yes. A favorite estimated at 80% but priced at -500 has about -$4 EV per $100 stake under that estimate. High chance of winning does not make any price attractive. The payout must be compared with a calibrated probability.
6. What is probability in sports betting?
Probability in sports betting represents an estimated likelihood of a market outcome. It can be derived from odds or estimated by a model, but these are different sources. Neither guarantees an individual result, and sportsbook prices often contain margin.
7. Why do losing streaks happen?
Losing streaks happen because uncertain outcomes can cluster, especially in small samples. Correlated events and changing conditions may amplify them. A streak does not mean a win is overdue; avoid increasing risk to recover earlier losses.
8. Do multiple player props increase correlation risk?
Yes. Props from the same game can depend on shared playing time, injuries, pace and game script. Treating them as independent may underestimate joint risk. Parlay probabilities require appropriate correlation modeling rather than simply multiplying unrelated-looking confidence labels.
9. How should AI confidence scores be evaluated?
Evaluate the definition of the score, historical frequencies within confidence bands, sample sizes, original odds and the age of model inputs. Publicly graded records are more meaningful than isolated successful screenshots. Confidence should be interpreted alongside risk and probability, not as a standalone promise.
10. Does a public track record guarantee future accuracy?
No. Public records help show what happened in the past, but seasons, markets and model inputs can change. Even a well-calibrated model produces unexpected losses. Past results and confidence labels cannot guarantee future accuracy or financial outcomes.
SprtGenie provides research and analytics, not a sportsbook or a guarantee of outcomes. Sports betting involves financial risk. 18+; follow applicable laws and responsible-gambling safeguards.