
Implied Probability in Sports Betting: How to Convert Odds Into Real Probabilities
Learn how implied probability works in sports betting, convert American and decimal odds into percentages, and understand sportsbook margins with easy examples.
Implied Probability in Sports Betting: How to Convert Odds Into Real Probabilities
Every betting price tells two stories. The first is what a sportsbook would pay if a selection wins. The second is the break-even success rate built into that price. Understanding this second number is essential to comparing markets objectively—even when a favorite looks likely to win. In implied probability sports betting analysis, the central question is not simply “Who wins?” but “What does this price require me to believe?”
Learning to convert betting odds to probability makes American moneylines, decimal prices, and fractional odds easier to compare. A betting probability calculator can do the arithmetic instantly, but knowing the formulas helps identify errors and misleading assumptions. This guide walks through conversion methods, explains bookmaker margins, and shows how to compare market prices with independent predictions. None of the calculations can reveal an outcome’s unknown true probability or guarantee a winning selection.
What Is Implied Probability in Sports Betting?
The Link Between Odds and the Break-Even Rate
Implied probability translates the payout terms of a price into the percentage of successful selections needed to break even in the long run, before accounting for other costs. A price of +100 pays $100 profit on a $100 stake and corresponds to 50%. At +150, a $100 stake would earn $150 profit if successful, so the implied rate is 40%. At -150, a bettor risks $150 to win $100, which corresponds to 60%. These percentages describe pricing—not a certified estimate of what will happen.
Market-Implied Probability Is Not the True Chance
A sportsbook sets and changes prices in response to information, risk controls, and market demand. Its displayed line may include a margin, differ across operators, or lag a rapidly changing market. An AI model supplies another estimate, also subject to error and uncertainty. Even when both numbers are available, the true future outcome probability cannot be observed directly before the event. Treat probability estimates as inputs for analysis, not certainty.
Why the Bookmaker Margin Matters
Sportsbooks commonly incorporate a margin—called vig, juice, or overround—into opposing prices. For example, both sides of an evenly balanced two-outcome market may be offered at -110. Each side has a raw implied probability of about 52.38%. Added together, these prices imply 104.76%, not 100%. The extra percentage is the overround; it does not mean there is more than a 100% real chance of outcomes occurring.
| Odds format | Example | Implied probability |
|---|---|---|
| American positive | +150 | 40.00% |
| American negative | -150 | 60.00% |
| Decimal | 2.50 | 40.00% |
| Fractional | 3/2 | 40.00% |
| Even money | +100 / 2.00 | 50.00% |
How to Convert Betting Odds to Probability
1. Positive American Odds
For positive American odds A, the implied probability percentage is 100 ÷ (A + 100) × 100. At +150: 100 ÷ 250 × 100 = 40.00%. At +200: 100 ÷ 300 × 100 = 33.33%. A larger positive number means a larger payout for the same stake and therefore a lower break-even success rate.
2. Negative American Odds
For negative American odds A, use |A| ÷ (|A| + 100) × 100. At -200: 200 ÷ 300 × 100 = 66.67%. At -110: 110 ÷ 210 × 100 = 52.38%. With a negative moneyline, the absolute value describes how much needs to be risked to win $100 in profit.
3. Decimal Odds
For decimal odds D, implied probability equals (1 ÷ D) × 100. At 1.80, the result is 55.56%. At 2.50, it is 40.00%. Decimal odds include the returned stake, so a $100 stake at 2.50 returns $250 in total—$150 in profit—when the selection wins.
4. Fractional Odds
For fractional odds a/b, use b ÷ (a + b) × 100. At 5/2, that is 2 ÷ 7 × 100 = 28.57%. The fraction describes profit relative to stake: 5/2 pays $5 profit for every $2 risked. Fractional and decimal formats are different ways of representing the same economic price.
5. Using a Betting Probability Calculator Correctly
A betting probability calculator can display the same price as American, decimal, or fractional odds and produce the corresponding break-even percentage. Enter the odds exactly as shown; distinguish +150 from -150, and avoid treating rounded decimal prices as perfectly precise. A converter does not use injuries, team quality, or game simulations. It transforms a price; it does not predict a winner.
6. Quick Odds Conversion Reference
| American odds | Decimal odds (rounded) | Implied probability |
|---|---|---|
| +100 | 2.00 | 50.00% |
| +120 | 2.20 | 45.45% |
| +150 | 2.50 | 40.00% |
| +200 | 3.00 | 33.33% |
| -105 | 1.95 | 51.22% |
| -110 | 1.91 | 52.38% |
| -150 | 1.67 | 60.00% |
| -200 | 1.50 | 66.67% |
| -300 | 1.33 | 75.00% |
Tip: calculate from the original American odds or unrounded decimal odds. A displayed 1.91 is only a rounded representation of the price -110, whose exact decimal equivalent is approximately 1.90952.
Understanding No-Vig Probability, Fair Odds, and Expected Value
Removing the Sportsbook Margin
In a two-outcome market with -110 on each side, each side implies 52.38095%. The total is 104.7619%, corresponding to a 4.7619-percentage-point overround. One straightforward no-vig method divides each side’s raw implied percentage by the total: 52.38095 ÷ 104.7619 × 100 = 50.00%. The normalized market estimate is therefore 50% for each side, despite each being priced at -110.
Proportional normalization is a convenient approximation, not a unique truth. Bookmakers may distribute their margin unevenly, particularly in markets with strong favorites, thin liquidity, or multiple outcomes. A no-vig figure remains an interpretation of market prices—not an independently verified probability.
From Probability to Expected Value
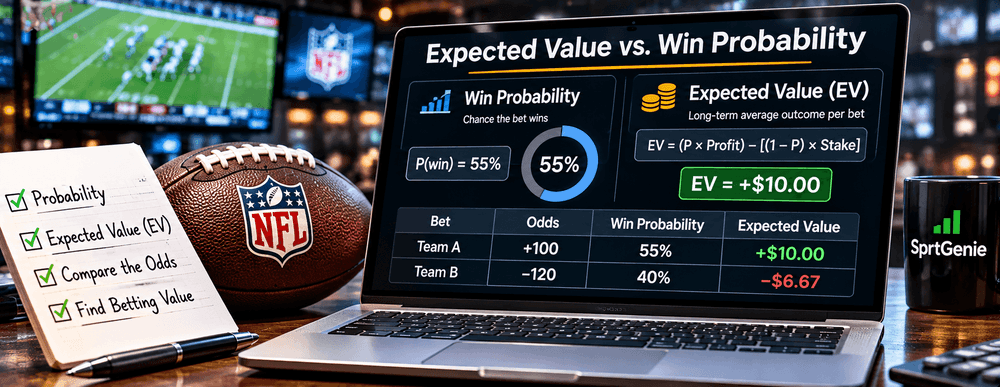
Expected value (EV) combines a probability estimate with the profit if correct and the amount lost if incorrect. For a $100 stake at +100, suppose an independent model estimates a 55% chance of success. Expected profit = 0.55 × $100 − 0.45 × $100 = +$10 per $100 wagered, or +10% model-estimated ROI. The sportsbook-implied rate at +100 is 50%, so the estimated probability edge is five percentage points.
This calculation is conditional on the 55% estimate being sound. If the actual chance were 48%, the same +100 price would imply a loss in expectation. A model’s error, changing conditions, and sample size can outweigh an apparent advantage; a positive estimated EV never guarantees profit.
| Illustrative metric | Value |
|---|---|
| Hypothetical model win probability | 55.00% |
| Sportsbook odds | +100 |
| Market-implied probability | 50.00% |
| Estimated probability difference | +5.00 percentage points |
| Estimated EV on $100 stake | +$10.00 |
| Guaranteed outcome? | No |
Mistakes That Distort Betting Probability Analysis
- Confusing a price-derived break-even percentage with an outcome’s true probability.
- Adding prices from opposing selections without accounting for the vig.
- Comparing different market conditions, thresholds, or settlement rules.
- Treating a model confidence score as identical to a calibrated win probability.
- Assuming a high-probability favorite automatically offers favorable value.
- Using outdated odds or rounded values without checking the original market.
- Treating one profitable result or a short streak as proof that a model is accurate.
Using Implied Probability With SprtGenie AI Sports Analytics
Comparing Model Estimates With Available Prices
SprtGenie positions its platform around AI sports predictions, odds comparison, and publicly graded results. For research, the useful workflow is to view an available price, convert it to implied probability, and compare that figure with any separate AI-estimated probability. The gap can identify an analytical question; it cannot establish that the model is right. Availability, exact market coverage, and the freshness of displayed data should be checked before drawing conclusions.
Why Different Sportsbooks Produce Different Break-Even Rates
Consider three hypothetical prices for the same exact selection: -110 implies 52.38%, -105 implies 51.22%, and +100 implies 50.00%. The underlying event has not changed simply because the posted price varies. The different figures represent different thresholds for breaking even at each offered price. They also show why a probability comparison is meaningful only when the market and rules are truly identical.
A Repeatable Probability Research Process
- Select one sporting event and identify the exact outcome and market.
- Record the American or decimal price, sportsbook, and update time.
- Convert the offered odds into the break-even implied probability.
- Check other available sportsbooks for comparable prices and rules.
- Consider the no-vig market estimate if appropriate.
- Review any independent model probability and its uncertainty.
- Check material changes such as lineup news, injuries, or market suspension.
- Record the selection, price, projected probability, and later actual result.
- Evaluate forecasts over adequate samples using calibration, ROI, and realized prices.
Use Public Track Records With Appropriate Context
An open prediction history can help users judge whether probabilities have been well calibrated. For example, selections assigned around 60% probability should win close to 60% of the time over a sufficiently large and representative sample if the probabilities are calibrated. Calibration is different from profitable returns, which also depend on the price obtained. SprtGenie’s public track record provides a starting point for checking outcomes, but no past record eliminates future uncertainty.
Explore SprtGenie’s AI predictions and public track record at sprtgenie.com and sprtgenie.com/track-record. The platform provides research information, not guaranteed outcomes. Adults only (18+); comply with local laws and set personal limits.
FAQ:
What is implied probability in sports betting?
Implied probability is the break-even success rate represented by a sportsbook price. A line at +100 implies 50%, while a line at -110 implies about 52.38%. Neither percentage guarantees the outcome will occur at that rate.
How do you convert betting odds to probability?
For positive American odds, divide 100 by the odds plus 100. For negative odds, divide the absolute odds by that amount plus 100. For decimal odds, divide 1 by the price. Multiply each result by 100 to express a percentage.
What is the implied probability of -110 odds?
Negative -110 odds imply 110 ÷ (110 + 100) × 100 = 52.38%. This is the approximate win rate required to break even at that price over many equivalent selections, before additional costs.
What does +150 mean in probability?
A +150 price implies 100 ÷ (150 + 100) × 100 = 40%. It would pay $150 profit on a winning $100 stake, with the original $100 stake also returned.
How do you calculate probability from decimal odds?
Divide 1 by the decimal price, then multiply by 100. For example, 1 ÷ 2.50 × 100 = 40%. Use the unrounded price when accuracy matters.
Is implied probability the same as actual probability?
No. Implied probability is derived from the offered price, which usually includes a sportsbook margin. Actual outcome probability is unknown in advance and can differ from both market prices and statistical model estimates.
What is a no-vig probability?
It is an estimate of market probability after removing or reallocating the bookmaker margin. One simple method normalizes the raw implied probabilities so they sum to 100%, although more sophisticated margin-allocation methods also exist.
Can a betting probability calculator predict winners?
A conventional odds calculator cannot. It converts prices into mathematical probabilities and, sometimes, payout values. Predictive models require separate sports data and can still make inaccurate forecasts.
How can AI help with implied probability analysis?
An AI model can offer an independently estimated outcome probability. Comparing that estimate with the probability implied by a sportsbook price may reveal a difference worth investigating, but model uncertainty and data quality are crucial.
Does higher implied probability mean a better opportunity?
Not necessarily. A favorite can have a high chance of winning and still be priced unattractively. The relevant comparison is between the offered payout and a credible estimate of the outcome’s chance, including uncertainty and risk.