
How to Read Confidence Scores, Risk Ratings, and Win Probabilities in Sports Betting
Understand a sports betting confidence score, betting probability, and risk analysis without confusing model confidence with guaranteed outcomes.
How to Read Confidence Scores, Risk Ratings, and Win Probabilities in Sports Betting
Sports analytics dashboards often show three numbers that appear to answer the same question: a sports betting confidence score, a win probability, and a risk rating. In reality, each can measure something different. A probability estimates how frequently an event should happen under a model. Confidence may represent the strength or reliability of the supporting signal. Risk may describe volatility, uncertainty, or the potential for a large adverse outcome. Unless a platform publishes its definitions, those labels should not be treated as interchangeable.
Clear betting probability and risk analysis help readers identify what a model knows, what it assumes, and what it cannot promise. This guide explains the core metrics, how they relate to sportsbook prices, and how to interpret SprtGenie’s displayed information more carefully.
Three Metrics That Should Never Be Confused
Win probability: frequency rather than certainty
A 70% model probability means that, among comparable events with well-calibrated 70% forecasts, the event should occur about seven times in ten. It does not mean it will occur in the next game. Probability needs a precisely defined outcome, such as an NFL moneyline result or an NBA total above a specific line.
Confidence: how strong the underlying signal appears
A confidence score can combine agreement among models, data completeness, model stability, or estimated statistical uncertainty. But platforms use different definitions. A 90/100 confidence badge is not necessarily a 90% win probability. SprtGenie describes confidence as a model-calibrated estimate of how strongly its data supports a pick; readers should interpret it in that stated context.
Risk: the fragility of a forecast
Risk may refer to unpredictable match conditions, thin data, correlated outcomes, changing lineups, or broad forecast distributions. The term can also mean financial exposure, which is a separate concept. A relatively likely outcome may carry poor financial value at very short odds. Low risk labels should never be read as “no chance of loss.”
| Metric | What it aims to express | What it does NOT mean |
|---|---|---|
| Win probability | Estimated chance of a defined outcome | Guaranteed result |
| Confidence score | Strength or reliability of modeled signal | Always equal to win chance |
| Risk rating | Volatility or uncertainty under a chosen framework | Guaranteed safety or positive return |
How Models Produce and Validate Those Numbers
Data quality, calibration, and missing information
A probability model typically combines historical results with roster changes, opponent strength, pace, venue, and other context. Its quality depends on both the underlying data and correct calibration. If predictions labeled 80% win only 65% over a sufficiently large out-of-sample sample, they are overconfident. Missing injuries or inaccurate starting lineups create another source of error that a neat dashboard may conceal.
Comparing model probability with market price
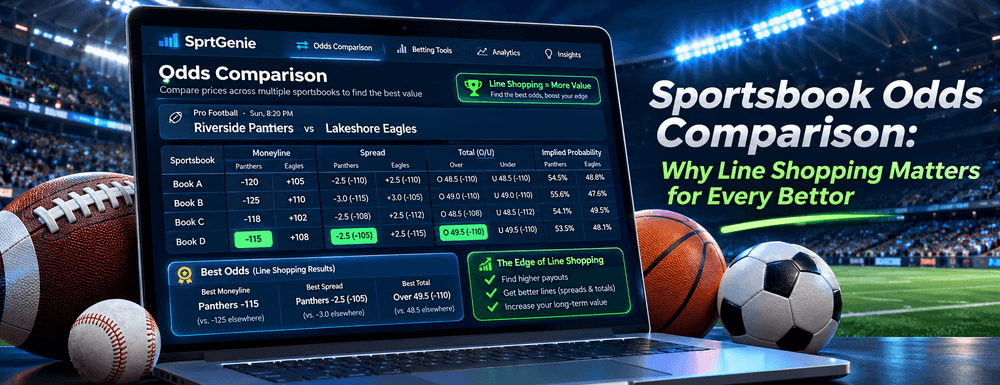
A sportsbook price has an implied break-even probability that includes the cost of the market. At -110, the threshold is approximately 52.38%. A 55% model estimate might suggest theoretical value at that price if the estimate is sound; if the true chance is 50%, the same trade is unfavorable. Probability estimates should therefore be evaluated by calibration, historical sample size, and honest out-of-sample tests.
For a hypothetical 55% chance at -110, the potential profit per $1 is about $0.9091 and expected profit is 0.55 × $0.9091 − 0.45 × $1 = approximately $0.05 per dollar. This example illustrates a formula, not a prediction or realized result.
Practical Examples of Confidence, Probability, and Risk
High probability with weak evidence
A heavily favored NBA team may have a 78% projected win chance, while the model has relatively low confidence because several players are questionable. The probability describes the current central estimate; the low confidence warns that the input assumptions could change sharply.
High confidence can coexist with a volatile outcome
A model may have strong historical support for its estimate that a baseball hitter reaches base, yet single-game hits remain variable. Confidence can be high in the forecasting process without indicating that the next event is safe.
Parlays compound uncertainty
Three independent legs with 70% chances each have only a 34.3% joint chance (0.7 × 0.7 × 0.7). Correlation may move the true combination probability higher or lower. A high confidence badge on each leg does not justify treating the parlay as high-confidence overall.
| Example | Estimated win probability | Confidence | Primary concern |
|---|---|---|---|
| Favorite with questionable starters | 78% | Moderate | Uncertain availability |
| Pitcher strikeout over | 55% | High | Single-game volatility |
| Three independent 70% legs | 34.3% jointly | Varies | Compounded uncertainty |
How to Interpret SprtGenie’s Dashboard Responsibly
SprtGenie shows AI selections, confidence scores, risk levels, available sportsbook odds, and a public track record. Treat the displayed confidence as a signal to investigate, not a replacement for probability and price. Evaluate a prediction in sequence: confirm the exact market; read the estimate; inspect confidence and risk; compare the quote with the implied probability; and review the historical record.
- Identify the event and verify the listed market threshold.
- Check whether the confidence label is a probability or a different score.
- Review injury and lineup information that could alter inputs.
- Compare available sportsbook prices with an estimated fair price.
- Examine the public track record, including losses, ROI, and sample size.
- Treat model uncertainty as a reason for restraint, never a reason to increase risk.
Publicly grading every outcome makes a system easier to assess, but a positive hit rate is not proof of profit: prices and staking assumptions matter. Seek evidence of calibration and price accuracy across substantial samples. A transparent platform should make uncertainty visible rather than hide it behind a percentage.
SprtGenie is an informational analytics platform, not a sportsbook. No confidence score or prediction guarantees an outcome; use only where legal, 18+, and within personally established limits.
FAQ:
What is a sports betting confidence score?
It is a metric intended to summarize the strength of supporting evidence or model signal, with definitions varying by platform.
Is a 90% confidence score a 90% win chance?
Not necessarily. Confidence and probability can be different measures.
What is betting probability?
It is an estimated chance for a clearly defined sporting event or market outcome.
How is implied probability calculated?
American negative odds use absolute odds divided by absolute odds plus 100; positive odds use 100 divided by odds plus 100.
What is risk analysis in sports predictions?
It evaluates uncertainty, volatility, sensitivity to assumptions, and sometimes financial exposure.
Can a likely outcome still be a poor price?
Yes. A short price can demand a higher success rate than the event is likely to achieve.
What does model calibration mean?
Across many forecasts at a given probability, the observed event frequency should approximately match that probability.
Why are player props often volatile?
Minutes, injuries, matchups, and a limited number of game opportunities can produce wide outcome distributions.
How should users read SprtGenie risk ratings?
As the platform’s stated assessment of market volatility, not a promise that a pick is safe.
Do confidence scores guarantee winning predictions?
No. Even reliable models routinely miss individual outcomes.