
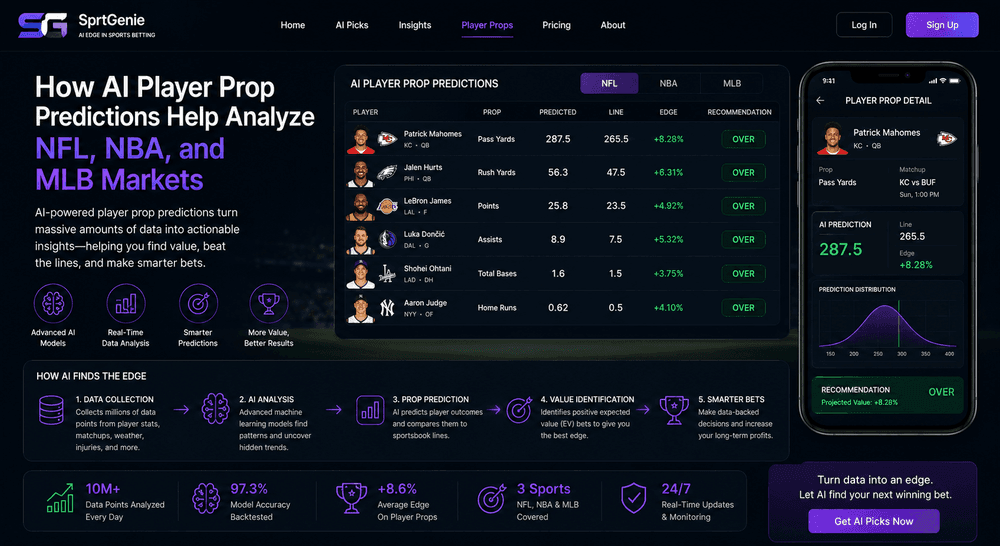
How AI Player Prop Predictions Help Analyze NFL, NBA, and MLB Markets
Player prop betting has become an important part of the US sports betting market. Instead of predicting only which team will win, bettors can evaluate individual player performance across hundreds of statistical categories.
An NFL market may ask whether a quarterback will throw for more or less than 265.5 yards. An NBA prop may focus on a player’s points, rebounds, assists, or a combined PRA total. In MLB, bettors can analyze pitcher strikeouts, hitter total bases, home runs, runs, and RBIs.
These markets create more choices, but they also require more detailed research. A useful player prop analysis must account for workload, role, opponent, game environment, injuries, starting lineups, and sportsbook price.
Artificial intelligence can process these variables quickly and convert them into player projections, estimated probabilities, confidence scores, and risk ratings. AI player prop predictions can make complex information easier to evaluate, but they cannot guarantee how a player will perform in a particular game.
What Are Player Prop Bets?
A player proposition bet, or player prop, is a market based on an individual athlete’s performance rather than only the final result of a game.
Most statistical props use an over/under format. A sportsbook establishes a threshold, and the bettor selects whether the player will finish above or below it.
Examples include:
NFL quarterback over or under 265.5 passing yards
NBA player over or under 7.5 assists
MLB pitcher over or under 5.5 strikeouts
Other player props may focus on whether an event will occur:
Anytime touchdown scorer
First basket scorer
Player to hit a home run
Player to record a double-double
Player to throw an interception
A player prop can win even when the player’s team loses. Similarly, a team can win while an individual player finishes below the relevant statistical line.
This makes player prop analysis different from evaluating a moneyline or point spread.
Why Player Props Are Difficult to Analyze
A player prop depends on more than the athlete’s average performance.
A player may have averaged 80 receiving yards over the previous five games, but that figure does not necessarily mean over 74.5 yards is a strong selection. The upcoming matchup may reduce the player’s target volume, weather may limit passing, or the team may be expected to rely more heavily on the running game.
Player performance can be affected by:
Playing time
Injuries
Team strategy
Opponent matchup
Coaching decisions
Game pace
Score and game script
Weather
Fouls or penalties
Substitutions
Unexpected in-game injuries
Averages also hide the distribution of results. Two players may both average 20 points, but one may consistently score between 18 and 22 while the other alternates between 10 and 30. Their probabilities of exceeding a 19.5-point line can differ considerably.
Effective player prop research must therefore evaluate the probability distribution, not just the average projection.
What Are AI Player Prop Predictions?
AI player prop predictions are statistical estimates generated by analyzing historical and current player-level data.
A model may evaluate the relationship between a player’s expected opportunity, opponent, team environment, and previous performance. It then produces a projected statistic or probability for the sportsbook market.
A complete AI player prop prediction should ideally include:
Player
Team and opponent
Prop category
Sportsbook line
Available odds
Model projection
Estimated over probability
Estimated under probability
Confidence score
Risk rating
Supporting factors
Time of the last update
The projection is not an exact forecast of what the player will record. It represents the model’s estimate based on the available information.
If an NBA model projects 27.3 points, the player will not necessarily score exactly 27 points. The player could score 15, 25, 32, or another total. For betting analysis, what matters is the estimated probability of finishing above or below the sportsbook threshold.
Projection vs. Probability
A projection and a probability answer different questions.
A projection estimates the player’s expected statistical performance. A probability estimates how likely the player is to exceed or remain below a specific prop line.
Suppose an AI system projects a wide receiver for 72 receiving yards. The sportsbook line is 68.5.
The projection is higher than the line, but that difference alone does not explain whether the over offers value. The model must estimate the full range of possible results and calculate the probability of exceeding 68.5 yards.
The app may determine:
Projected receiving yards: 72
Probability of going over 68.5: 56%
Probability of going under 68.5: 44%
You can then compare the 56% estimate with the sportsbook odds.
What Data Does AI Use for Player Prop Analysis?
The relevant inputs vary by sport and prop category. Most useful models combine several categories of information.
Historical Player Performance
Historical information may include:
Season averages
Recent-game performance
Home and away splits
Performance against similar opponents
Statistical distribution
Consistency
Previous results at comparable prop lines
Recent games can provide useful information, but they should not automatically receive the greatest weight. A short streak may result from unusual matchups, temporary shooting efficiency, overtime, or increased opportunity that will not continue.
Expected Workload
Opportunity is one of the most important variables in player prop analysis.
Depending on the sport, workload may be measured through:
Minutes
Snaps
Routes
Carries
Targets
Shot attempts
Possessions
Plate appearances
Pitch count
Expected innings
A strong per-minute or per-snap player cannot produce the projected statistic without sufficient playing time.
AI models can estimate workload using starting status, recent usage, coaching patterns, injuries, game conditions, and expected team strategy.
Player Role and Usage
A player’s role can change without immediately appearing in season-long averages.
Examples include:
A backup running back becoming the starter.
A wide receiver receiving more targets after a teammate’s injury
An NBA player entering the starting lineup
A hitter moving higher in the batting order
A pitcher operating under a new pitch-count restriction
AI systems can adjust projections when role changes are represented in current data. Human review is still valuable because late or informal coaching information may not reach every data feed immediately.
Opponent Matchup
Player props depend heavily on the opponent.
Relevant matchup information may include:
Defensive performance by position
Coverage scheme
Rebounding opportunities
Pace
Opponent strikeout rate
Pitcher or hitter handedness
Pitch-type performance
Ballpark characteristics
Expected game script
A player who performed well against weaker opponents may face a substantially different probability against an elite defense.
Injuries and Starting Lineups
The absence of one player can change the opportunities available to several others.
An injured NBA scorer may increase teammates' shot volume and usage. An unavailable NFL receiver can create additional targets for another player. An MLB lineup change can affect projected plate appearances, runs, and RBIs.
AI models should update after:
Player availability changes
Starting lineups are confirmed.
Minutes restrictions are announced.
Pitchers or goaltenders are replaced.
Teammates are ruled out.
A prediction created before a major lineup update may no longer be relevant.
Game Environment
Player performance is connected to the wider game.
AI may consider:
Point spread
Game total
Expected pace
Home-field advantage
Rest
Travel
Weather
Venue
Playoff context
Probability of overtime or extra innings
For example, an NFL team expected to play from behind may attempt more passes. This could increase passing and receiving opportunities while reducing rushing volume.
Real-Time Sportsbook Information
Sportsbook lines reflect market expectations.
AI platforms can monitor:
Opening prop line
Current prop line
Odds changes
Differences between sportsbooks
Market availability
Recent movement
A useful prediction must be evaluated against the current line and price. A projection can remain unchanged while the market value disappears.
How AI Turns Player Data Into a Prop Prediction
The analytical process generally follows several stages.
Step 1: Collect and Standardize Data
The system combines player statistics, team information, schedules, injuries, lineups, weather, and sportsbook markets.
Names, teams, games, and prop categories must be matched correctly across all sources. Remove duplicate or outdated records.
Step 2: Estimate Playing Opportunity
The model estimates how much the player is likely to participate.
This may include:
Expected minutes
Expected snaps
Projected carries
Projected targets
Expected plate appearances
Projected pitch count
The workload estimate can materially affect the final projection.
Step 3: Project Statistical Performance
The model evaluates how efficiently the player is expected to use those opportunities.
A wide receiver projection may combine expected targets with catch probability and yards per reception. An NBA assist projection may combine expected minutes, ball-handling responsibilities, potential assists, and teammate shooting. A pitcher strikeout projection may combine expected batters faced with strikeout probability.
Step 4: Estimate the Distribution of Outcomes
The model considers a range of possible performances rather than only one projected average.
This allows it to estimate the probability that the player will finish:
Above the line
Below the line
Exactly on the line, where a push is possible
Step 5: Compare the Probability With the Odds
You can convert American odds into implied probability.
For positive odds:
Implied probability = 100 ÷ (positive odds + 100)
For negative odds:
Implied probability = absolute odds ÷ (absolute odds + 100)
If an AI model estimates a 57% probability for an over while the sportsbook price implies approximately 51%, the difference may represent a potential model edge.
Step 6: Calculate Confidence and Risk
A confidence score may reflect:
Data quality
Stability of the player’s role
Sample size
Lineup certainty
Agreement between models
Historical performance in similar markets
Risk may increase when a player has an uncertain workload, recent injury, volatile role, or limited historical data.
Step 7: Update the Prediction
Predictions should change when relevant information changes.
Updates may follow:
Injury reports
Confirmed starting lineups
Weather changes
Prop line movement
Player participation news
Live game developments
How AI Analyzes NFL Player Props
NFL player props depend heavily on expected game script, player opportunity, opponent strategy, and weather.
Because teams play relatively few games, sample sizes are smaller than in NBA or MLB markets. Role changes and opponent adjustments can have a significant effect.
Quarterback Props
Common quarterback markets include:
Passing yards
Passing touchdowns
Completions
Passing attempts
Interceptions
Rushing yards
Longest completion
An AI model may analyze:
Expected pass attempts
Offensive pace
Opponent pass defense
Defensive pressure rate
Offensive line performance
Receiver availability
Weather
Point spread
Game total
A quarterback on a favored team may have a lower passing-volume projection if the model expects the offense to protect a lead through the running game. A quarterback playing as a significant underdog may be projected for more attempts because of an expected pass-heavy game script.
Running Back Props
Common markets include:
Rushing yards
Carries
Receptions
Receiving yards
Anytime touchdown
Longest rush
Important variables include:
Expected carries
Snap share
Goal-line role
Offensive line performance
Opponent rushing defense
Point spread
Other available running backs
A running back may have a strong average but an uncertain projection when the team uses a committee approach.
Wide Receiver and Tight End Props
Common markets include:
Receptions
Receiving yards
Targets
Longest reception
Anytime touchdown
AI may evaluate:
Target share
Route participation
Air-yard share
Defensive coverage
Quarterback efficiency
Injuries to other receivers
Expected pass volume
NFL Prop Example
Suppose an AI model produces the following receiving-yards analysis:
Model projection: 72.8 yards
Sportsbook line: 68.5 yards
Estimated over probability: 56%
Available odds: -105
Implied probability: approximately 51.22%
The simplified model edge is:
56% − 51.22% = 4.78 percentage points
This difference may indicate potential value. The user should still review weather, target competition, injury status, and whether the -105 price remains available.
How AI Analyzes NBA Player Props
NBA player prop models have access to extensive game and player data, but late lineup changes can substantially alter projections.
Points Props
An AI points model may analyze:
Expected minutes
Usage rate
Shot attempts
Free-throw attempts
Three-point volume
Opponent defensive efficiency
Pace
Injured teammates
Expected lineup
A player’s recent scoring average may be less important than how his role changes when a high-usage teammate is unavailable.
Rebounds Props
Rebound projections can include:
Expected minutes
Rebound chances
Opponent shooting profile
Team and opponent pace
Player position
Lineup size
Available teammates
A center facing a team that attempts many three-pointers may encounter a different rebound distribution than against a team that attacks primarily near the basket.
Assists Props
Assist models may evaluate:
Ball-handling role
Potential assists
Time of possession
Teammate shooting
Expected minutes
Opponent defensive strategy
Lineup changes
An injured starting point guard may create additional playmaking opportunities for another player.
Combined NBA Props
Combined markets include:
Points, rebounds, and assists
Points and rebounds
Points and assists
Rebounds and assists
Steals and blocks
Combined props can reduce dependence on one statistical category, but they also require the model to account for relationships among several types of performance.
NBA Prop Example
Suppose an AI system projects an NBA player for 34.2 points, rebounds, and assists.
Sportsbook line: 31.5 PRA
Estimated over probability: 58%
Available odds: -115
Implied probability: approximately 53.49%
The simplified edge is:
58% − 53.49% = 4.51 percentage points
Before evaluating the selection, confirm the starting lineup, expected minutes, injury status, and the possibility of a blowout.
Why Confirmed NBA Lineups Matter
NBA teams may rest players, change rotations, or announce late availability decisions.
A starting lineup change can affect:
Minutes
Usage
Shot attempts
Assists
Rebounds
Defensive matchup
Team pace
A player prop prediction should therefore show when it was last updated and whether the lineup was confirmed at that time.
How AI Analyzes MLB Player Props
Baseball provides a large amount of historical data, but individual games are still influenced by lineups, pitchers, weather, and ballpark conditions.
Pitcher Strikeout Props
AI strikeout models may evaluate:
Pitcher strikeout rate
Opponent strikeout rate
Expected batters faced
Projected pitch count
Recent workload
Pitch efficiency
Opponent lineup
Umpire tendencies
Weather
Bullpen availability
A pitcher with a strong strikeout rate may still have a limited projection if the team is expected to control his pitch count.
Pitcher Outs and Innings Props
These markets depend on:
Expected pitch count
Manager tendencies
Opponent contact rate
Walk rate
Recent workload
Bullpen condition
Game importance
A pitcher can perform well but still finish below an outs prop if the manager removes him early.
Hitter Props
Common hitter markets include:
Hits
Total bases
Runs
RBIs
Home runs
Walks
Stolen bases
AI can analyze:
Batting-order position
Expected plate appearances
Pitcher handedness
Pitch-type matchups
Contact quality
Ballpark dimensions
Weather
Bullpen matchup
Batter-Pitcher Matchups
Individual matchup history can be informative, but small head-to-head samples should not carry too much weight.
More stable variables may include:
Batter performance by pitch type
Pitcher pitch selection
Handedness splits
Strikeout and walk rates
Expected contact quality
Ballpark and Weather Factors
MLB stadiums differ in dimensions, altitude, and typical run environment. Temperature and wind can also affect how the ball travels.
These variables may influence:
Home run probability
Total bases
Runs
RBIs
Pitcher performance
MLB Prop Example
Suppose a model analyzes a pitcher strikeout market:
Model projection: 6.4 strikeouts
Sportsbook line: 5.5
Estimated over probability: 55%
Available odds: +100
Implied probability: 50%
The simplified edge is 5 percentage points.
The prediction should still be reviewed against the confirmed opposing lineup, expected pitch count, weather, and current price.
NFL vs. NBA vs. MLB Player Prop Modeling
Factor
NFL
NBA
MLB
Primary workload metrics
Snaps, routes, carries, targets
Minutes, usage, possessions
Plate appearances, pitches, innings
Important late information
Injuries, inactive list, weather
Starting lineup, rest, minutes restrictions
Confirmed lineup, starting pitcher
Major contextual factor
Expected game script
Pace and rotation
Pitcher-hitter matchup
Typical update cycle
Weekly and game-day
Daily and pregame
Daily and lineup-dependent
Common prop markets
Yards, receptions, touchdowns
Points, rebounds, assists
Strikeouts, hits, total bases
The differences demonstrate why a single generic player prop model may be insufficient. Each sport requires specialized variables and probability distributions.
Why Real-Time Odds Matter
A player projection can stay the same while the betting value changes.
Suppose a model gives an over a 56% probability.
At -105, the implied probability is approximately 51.22%. At -125, the implied probability increases to approximately 55.56%.
The same prediction may appear potentially valuable at -105 and nearly neutral at -125.
The sportsbook can also change the threshold:
Over 68.5 receiving yards at -110
Over 71.5 receiving yards at +100
Over 74.5 receiving yards at +115
The highest positive price is not automatically the best option because the player must exceed a more difficult threshold.
Users should compare both the line and the price.
Line Shopping for Player Props
Different sportsbooks may publish different player prop thresholds.
For an NBA assists prop, the market may show:
Over 6.5 at -120
Over 7.5 at +105
Under 7.5 at -125
Under 8.5 at -155
AI projections can help estimate the probability of each outcome. Bettors can then determine whether the stronger threshold compensates for the less favorable price.
Line shopping is valuable because player prop markets can be less consistent across sportsbooks than major game lines.
Users should verify that:
The statistical category is identical.
Overtime treatment is the same.
Player participation rules match.
The line is still available.
The odds are current.
How AI Identifies Potential Positive EV Props
Expected value compares the probability of winning with the potential profit and risk.
The simplified formula is:
EV = (Probability of winning × Potential profit) − (Probability of losing × Amount risked)
Suppose an AI model estimates a player prop has a 57% chance of winning. The sportsbook offers +105.
For a $100 bet:
EV = (0.57 × $105) − (0.43 × $100)
EV = $59.85 − $43
EV = +$16.85
The theoretical expected value is +16.85% of the amount risked.
This does not mean the bet will produce $16.85. The actual result is either a $105 profit or a $100 loss. EV describes the theoretical average across many comparable decisions, assuming the 57% probability is accurate.
Pregame vs. Live Player Prop Predictions
Pregame Props
Pregame markets provide more time to:
Review projections
Compare sportsbooks
Confirm injuries
Analyze the matchup
Evaluate historical performance
However, late lineup changes can reduce the relevance of an earlier prediction.
Live Props
Live player prop models can incorporate:
Current playing time
Existing statistics
Score
Pace
Foul trouble
In-game injuries
Remaining time
Updated sportsbook lines
Live analysis reflects current game conditions but provides less time for comparison and decision-making. Odds may change within seconds.
A player performing above expectations early in the game may receive a much higher live prop line, reducing or eliminating any earlier value.
Player Props and Same-Game Parlays
Player props are frequently combined into same-game parlays. AI can estimate the probability of individual legs and examine how the outcomes may be related.
Examples of potential correlation include:
Quarterback passing-yards over and receiver receiving-yards over.
NBA scorer points over and team total over
Pitcher strikeouts over and opposing hitter hits under
Correlation can be positive, negative, or weak. Calculating the combined probability is more difficult than multiplying independent probabilities when the selections are related.
Sportsbooks may adjust same-game parlay payouts to account for these relationships.
Adding more legs generally reduces the probability that the entire parlay wins. AI can help identify a weak leg, but it cannot remove the structural risk of combining multiple selections.
Advantages of AI Player Prop Predictions
Faster Analysis
AI can review many players and markets simultaneously, reducing the time required for manual research.
Consistent Evaluation
The model can apply the same analytical criteria to every player instead of changing its process according to emotion or recent headlines.
Real-Time Updates
Predictions can be recalculated after injuries, lineup announcements, and sportsbook line movement.
Multi-Sport Coverage
Specialized models can support NFL, NBA, MLB, and other sports while accounting for their different statistical structures.
Probability-Based Context
AI can present a projection with estimated probability, price, confidence, and risk rather than providing only an over-or-under selection.
Limitations of AI Player Prop Predictions
Late or Incorrect Information
A model can produce a misleading projection if a lineup, injury status, or workload estimate is outdated.
Unpredictable Game Flow
Blowouts, overtime, foul trouble, weather delays, early injuries, and coaching decisions can change player opportunity.
Limited Samples
Rookies, recently traded players, and athletes entering new roles may not have enough relevant historical data.
Overreliance on Recent Trends
A short run of strong results may reflect favorable variance rather than a permanent performance change.
Model Quality
Different models may produce different projections. A sophisticated interface does not guarantee that the underlying model is well calibrated.
Outdated Odds
A useful projection can become an unfavorable bet when the line or price moves.
How to Evaluate an AI Player Prop Platform
A useful platform should provide transparent information, not unsupported claims.
Look for:
Clear player projection
Estimated over and under probabilities
Current sportsbook line
Odds from multiple sportsbooks
Timestamp
Injury and lineup updates
Supporting analysis
Confidence and risk
Historical model results
Performance by league and prop category
Historical performance should include more than win rate. Useful metrics include:
Sample size
Average odds
Return on investment
Closing line value
Probability calibration
A platform that reports only winning selections or a short successful period does not provide enough evidence for evaluation.
Step-by-Step Player Prop Research Process
Step 1: Select the League and Prop
Choose an NFL, NBA, or MLB market supported by sufficient current data.
Step 2: Review the Projection
Identify the model’s expected statistical result and estimated probability for the over and under.
Step 3: Check Expected Workload
Confirm expected snaps, targets, minutes, plate appearances, or pitch count.
Step 4: Analyze the Matchup
Review opponent defense, pace, coverage, pitcher-hitter data, and game environment.
Step 5: Confirm Injuries and Lineups
Determine whether the prediction reflects the latest available information.
Step 6: Compare Sportsbook Lines
Check multiple sportsbooks for stronger thresholds and prices.
Step 7: Review Confidence and Risk
Understand the stability of the player’s role and the main sources of uncertainty.
Step 8: Evaluate Potential Value
Compare the model probability with the probability implied by the current odds.
Step 9: Bet or Pass
A high projection does not require action. Passing can be appropriate when the price is unfavorable or important information is missing.
Step 10: Track the Result
Record the sportsbook, line, odds, model probability, closing line, and final result.
Common Player Prop Betting Mistakes
Common mistakes include:
Betting based only on recent games
Ignoring expected minutes or snaps
Using season averages without matchup context
Failing to check starting lineups
Accepting the first available sportsbook line
Confusing a high projection with positive value
Ignoring the price attached to the prop
Adding too many props to a parlay
Increasing stakes after losses
Treating AI predictions as guaranteed outcomes
Avoiding these mistakes doesn't guarantee success, but it can improve the quality and consistency of your research process.
How SprtGenie Supports Player Prop Analysis
SprtGenie uses AI-powered sports analysis to help users evaluate games, players, and betting markets through mobile and web applications.
The platform can support player prop research by providing:
AI-generated performance insights
Real-time odds information
Suggested picks
Confidence indicators
Risk assessments
Personalized sports and market recommendations
SprtGenie’s SnapTap feature allows users to capture a photo or short video of a game. The platform can recognize the match and provide relevant live insights, suggested picks, odds, confidence, and risk.
This can reduce the time required to identify a game and access related information. Users should still confirm that the relevant prop market is available, review the current line, and consider whether the prediction reflects the latest lineup and injury news.
SprtGenie is a research and insights tool. It cannot guarantee that a player will exceed or remain below a prop line.
AI Player Prop Analysis Checklist
Before evaluating a player prop, ask:
Is the player confirmed to participate?
Is the expected workload realistic?
Has the player’s role recently changed?
Does the model account for the opponent matchup?
Are injuries and starting lineups current?
What is the projected statistical result?
What is the estimated over or under probability?
How stable is the projection?
What are the main risk factors?
Have multiple sportsbooks been compared?
Is a better threshold available?
Are the displayed odds current?
Does the available price offer potential value?
Has the selection been recorded for later evaluation?
Final Thoughts
AI player prop predictions can help bettors analyze the detailed information required for NFL, NBA, and MLB markets.
NFL models can examine snaps, routes, carries, targets, weather, and game script. NBA models can evaluate minutes, usage, pace, lineups, and positional matchups. MLB models can process pitch counts, batting order, pitcher-hitter relationships, weather, and ballpark conditions.
AI's analytical advantage comes from its ability to process large datasets quickly and update projections as new information becomes available. Its output is most useful when it includes probabilities, current odds, clear explanations, confidence, and risk.
No projection can determine exactly how a player will perform. Injuries, coaching decisions, foul trouble, weather, blowouts, and random variation remain part of every market.
Users should treat AI as a research tool, compare sportsbook lines, confirm current information, and decide whether the available price supports the prediction. All betting decisions should be made responsibly and in accordance with applicable age and jurisdiction requirements.
FAQ:
What is an AI player prop prediction?
An AI player prop prediction is a statistical estimate of an individual player’s performance. It may include a projected result, the probability of going over or under a sportsbook line, a confidence score, and a risk rating.
How does AI predict NFL player props?
AI can analyze expected snaps, carries, routes, targets, opponent defense, weather, injuries, and expected game script to project passing, rushing, receiving, and scoring markets.
How does AI analyze NBA points, rebounds, and assists?
NBA models can evaluate expected minutes, usage, pace, lineup combinations, shot attempts, rebound chances, potential assists, and opponent defensive performance.
How does AI predict MLB pitcher and hitter props?
MLB models may use pitch count, strikeout rate, opponent lineup, pitcher-hitter matchups, batting-order position, ballpark factors, weather, and expected plate appearances.
Are AI player prop predictions accurate?
Accuracy depends on data quality, model design, calibration, market type, and current information. No model predicts every player result correctly.
Can AI guarantee a winning player prop?
No. AI estimates probabilities and cannot guarantee an individual player’s performance.
Why do player prop lines move?
Lines can move after injuries, lineup changes, workload announcements, weather updates, betting activity, or sportsbook adjustments.
How important are starting lineups?
Starting lineups can materially affect minutes, usage, targets, plate appearances, and other opportunities. Update predictions when lineups change.
What is the difference between a projection and a probability?
A projection estimates the expected statistical result. A probability estimates how likely the player is to finish above or below a specific sportsbook line.
How can bettors compare player prop odds?
Compare the same player, statistical category, threshold, price, and settlement rules across multiple sportsbooks. Both the line and attached odds matter.
Can AI identify positive-EV player props?
AI can compare its estimated probability with sportsbook odds to identify potential model edges. Positive EV does not guarantee that the selection will win.
Can AI analyze player props in same-game parlays?
AI can estimate individual leg probabilities and examine correlation. Calculating combined probability is more difficult when selections are related.
Are live player prop predictions more accurate?
Live predictions use current game information, but they are not automatically more accurate. Live markets change quickly and can be highly volatile.
What should bettors look for in an AI player prop app?
Look for current data, transparent projections, over-and-under probabilities, multiple sportsbook lines, clear timestamps, injury and lineup updates, historical performance, and responsible risk communication.