
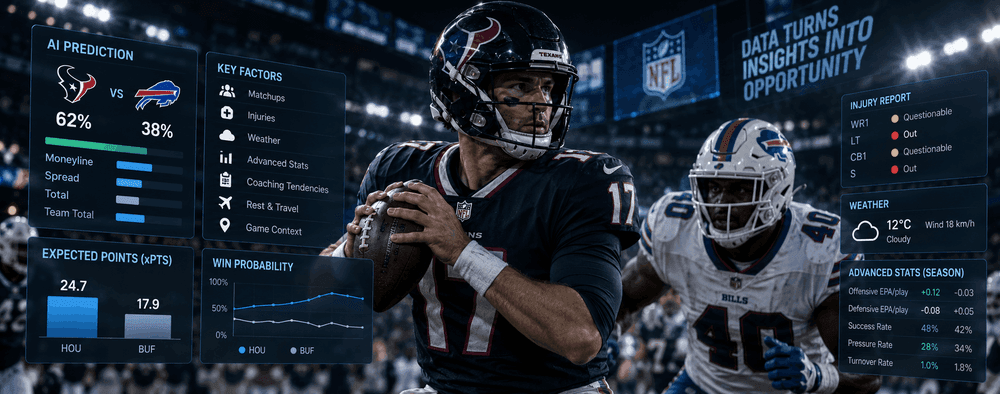
How AI Analyzes NFL Games: Matchups, Injuries, Weather, and Advanced Statistics
NFL games are influenced by far more than team records and basic box-score statistics. Quarterback efficiency, offensive-line performance, injuries, weather, coaching tendencies, travel, and specific positional matchups can all affect the probability of an outcome.
Modern AI NFL predictions combine these signals to build probability-based estimates rather than relying on one statistic.
AI cannot guarantee an NFL result. Its advantage is the ability to process many variables consistently and update projections when new information becomes available.
How AI Analyzes an NFL Game
A prediction model can evaluate team strength, player performance, injuries, environmental conditions, and market information together.
| Input | What It Helps Measure |
|---|---|
| Offensive efficiency | Ability to sustain drives and score |
| Defensive efficiency | Ability to limit opposing offenses |
| Quarterback performance | Passing quality and decision-making |
| Positional matchups | Specific strengths and weaknesses |
| Injuries | Changes in expected team strength |
| Weather | Passing, kicking, and scoring conditions |
| Rest and travel | Preparation and fatigue |
| Coaching tendencies | Expected strategic decisions |
| Sportsbook odds | Market expectations and pricing |
A simplified workflow is:
Team efficiency → Matchups → Injuries → Game conditions → Expected game script → Probability → Market price
Why Matchups Matter
Overall records do not always show how two teams match up against each other.
A team may have a strong season record but face a specific weakness that its opponent can exploit.
| Matchup | What AI May Analyze |
|---|---|
| QB vs. defense | Pressure response, coverage, interceptions |
| Offensive line vs. pass rush | Pressure rate, sacks, protection |
| Receivers vs. secondary | Target efficiency, coverage, CB availability |
| Run game vs. run defense | Rushing efficiency and defensive resistance |
| Mobile QB vs. front seven | Scramble and containment performance |
For example, an elite passing offense may have a significant advantage against a secondary missing multiple starters.
AI attempts to capture these interactions instead of simply labeling one team as stronger.
Quarterback Performance
Quarterback play is one of the most influential variables in NFL modeling.
Basic passing yards can be useful, but efficiency statistics provide additional context.
| QB Metric | What It Measures |
|---|---|
| EPA per dropback | Value created on passing plays |
| Success rate | Consistency of productive plays |
| CPOE | Completion rate compared with expectation |
| Sack rate | How often passing plays end in sacks |
| Interception rate | Turnover tendency |
| Deep-pass efficiency | Performance on longer throws |
| Red-zone efficiency | Performance near the goal line |
A quarterback can throw for 300 yards and still have an inefficient game if those yards come on many low-value attempts.
EPA, Success Rate, and Other Advanced Statistics
Advanced NFL metrics help AI models measure the value and consistency of individual plays.
EPA — Expected Points Added measures how much a play changes a team's expected scoring position.
Success rate measures how frequently an offense produces a positive result relative to the game situation.
| Metric | What It Tells the Model |
|---|---|
| EPA/play | Overall efficiency |
| Success rate | Consistency |
| CPOE | QB accuracy relative to expectation |
| Pressure rate | Pass-rush effectiveness |
| Sack rate | Protection and QB response |
| Explosive-play rate | Big-play potential |
| Red-zone efficiency | Ability to finish drives |
| Third-down rate | Drive sustainability |
| Turnover rate | Ball-security risk |
| Pace | Potential number of possessions |
Rather than relying on one metric, AI can combine multiple measures to build a broader picture of team quality.
Offensive Line vs. Defensive Front
Pass protection can significantly change offensive expectations.
Models may consider:
| Offensive Line Data | Defensive Front Data |
|---|---|
| Pass-block efficiency | Pressure rate |
| Pressure rate allowed | Blitz frequency |
| Sack rate allowed | Sack rate |
| Run-block performance | Run-defense efficiency |
| Injuries | Edge-rusher availability |
If an offense with weak protection faces an elite pass rush, an AI model may reduce expected quarterback efficiency and scoring.
That adjustment can influence the moneyline, spread, total, and player props.
Receivers and Secondary Matchups
Passing performance also depends on the matchup between receivers and defensive backs.
Relevant data can include:
- Target share
- Route participation
- Yards per route run
- Catch rate
- Air yards
- Explosive receptions
- Coverage tendencies
- Cornerback injuries
A secondary missing its top cornerback may materially change expectations for the opposing team's passing game.
Run Game vs. Run Defense
AI can also compare rushing efficiency with defensive performance.
| Running Offense | Run Defense |
|---|---|
| Rushing EPA | Defensive rushing EPA |
| Run success rate | Stuff rate |
| Yards before contact | Line-of-scrimmage control |
| Yards after contact | Tackling efficiency |
| Short-yardage success | Short-yardage defense |
An effective run game can influence possession, play-action opportunities, game tempo, and expected game script.
How Injuries Affect NFL Predictions
AI should not treat every injury equally.
The player's position, role, replacement quality, and matchup all matter.
| Position | Possible Impact |
|---|---|
| Quarterback | Major offensive adjustment |
| Left tackle | Pass protection and pressure |
| WR1 | Targets and explosive plays |
| Running back | Rushing and receiving volume |
| Cornerback | Opponent passing efficiency |
| Edge rusher | Pressure and sack expectations |
| Kicker | Field-goal probabilities |
The quality of the replacement is also important.
Losing a starter may have limited impact when the backup is strong, while a large drop in replacement quality can create a substantial model adjustment.
Why QB Injuries Matter More
Quarterback changes can affect nearly every offensive projection.
When a starting quarterback is unavailable, AI may adjust:
- Passing efficiency
- Passing depth
- Sack rate
- Turnover risk
- Scoring expectations
- Receiver production
- Running-game usage
That is why a quarterback announcement can move game probabilities, spreads, totals, and player props simultaneously.
Injury Clusters
Sometimes the important issue is not one injured player but several injuries within the same position group.
| Injury Cluster | Potential Effect |
|---|---|
| Multiple offensive linemen | Increased pressure and reduced rushing efficiency |
| Several cornerbacks | Greater passing vulnerability |
| Multiple receivers | Reduced passing options |
| Several pass rushers | Lower pressure expectations |
| Multiple defensive starters | Overall defensive decline |
AI can account for these combinations instead of simply counting the number of injured players.
Weather and NFL Predictions
Weather matters primarily for outdoor games.
The main variables include:
| Weather Factor | Possible Impact |
|---|---|
| Strong wind | Deep passing, field goals, punts |
| Heavy rain | Ball security and passing efficiency |
| Snow | Traction and field conditions |
| Extreme cold | Kicking and ball handling |
| Heat | Fatigue and player rotation |
Wind can be particularly relevant because it may directly affect both passing depth and kicking.
However, weather should be considered alongside team style. A run-heavy offense may be less affected than a vertical passing attack.
Dome vs. Outdoor Games
Indoor games eliminate several environmental variables.
In a dome:
- Wind is removed.
- Temperature is controlled.
- Rain and snow are irrelevant.
- Field conditions are generally more predictable.
Outdoor projections may change more frequently as game-day forecasts become clearer.
Rest, Travel, and Home Field
Scheduling conditions can create smaller but still useful model adjustments.
| Factor | Potential Effect |
|---|---|
| Short week | Reduced preparation and recovery |
| Bye week | Additional rest and planning |
| Cross-country travel | Travel and recovery burden |
| International game | Unusual travel and routine |
| Consecutive road games | Accumulated travel |
| Home field | Crowd, familiarity, and reduced travel |
AI can also account for stadium-specific characteristics such as altitude, playing surface, and crowd noise.
Coaching Tendencies
NFL teams do not make decisions randomly.
Coaches develop patterns that AI can analyze.
Relevant tendencies include:
- Pass rate over expectation
- Early-down passing
- Fourth-down aggressiveness
- Blitz frequency
- Red-zone play calling
- Pace
- Two-minute offense
These tendencies can help models estimate how teams may approach specific game situations.
Game Script
Game script describes the expected flow of a matchup.
| Expected Situation | Potential Effect |
|---|---|
| Favorite builds a lead | More rushing attempts |
| Underdog trails | More passing volume |
| High-scoring matchup | More offensive opportunities |
| Defensive game | Lower play and scoring expectations |
| Run-heavy control | Fewer possessions |
Game script is especially important for player props.
A running back may benefit when his team is expected to lead, while a quarterback or wide receiver may see greater volume when the team is expected to trail.
Why Turnovers Are Difficult to Predict
Turnovers have a major impact on NFL games, but individual turnover outcomes contain substantial randomness.
AI can estimate tendencies using:
- Interception rates
- Pressure
- Sack tendencies
- Quarterback decision-making
- Fumble history
But tipped passes and fumble recoveries are difficult to forecast precisely.
A good model should therefore distinguish turnover risk from certainty that a turnover will occur.
How AI Analyzes NFL Player Props
AI can also estimate player-level outcomes.
| Prop Market | Important Inputs |
|---|---|
| Passing yards | Attempts, matchup, pressure, game script |
| Passing TDs | Red-zone opportunities and scoring expectation |
| Rushing yards | Carries, line matchup, game script |
| Receiving yards | Routes, targets, matchup |
| Receptions | Target share and expected pass volume |
| Anytime touchdown | Usage and red-zone opportunities |
Player props often depend heavily on expected volume.
For example, a receiver's efficiency may remain unchanged, but his projection can increase if the model expects significantly more passing attempts.
Example of an AI NFL Analysis
Consider a hypothetical matchup:
| Factor | Team A | Team B |
|---|---|---|
| Offensive EPA/play | +0.14 | +0.05 |
| Defensive EPA/play | -0.08 | +0.03 |
| QB | Starter | Starter |
| Key injury | WR2 out | CB1 out |
| Pressure rate | 31% | 22% |
| Rest | 7 days | 5 days |
| Weather | Mild | Mild |
A model might estimate:
| Outcome | Probability |
|---|---|
| Team A win | 61% |
| Team B win | 39% |
The model may favor Team A because of stronger offensive efficiency, better defensive performance, a stronger pass rush, more rest, and a potentially favorable passing matchup.
The probability comes from the combined picture—not one statistic.
AI Predictions for Different NFL Markets
AI can use the same core data differently depending on the market.
| Market | Main Question |
|---|---|
| Moneyline | Which team is more likely to win? |
| Spread | What is the expected scoring margin? |
| Game total | How many total points are expected? |
| Team total | How many points may one team score? |
| Player prop | What is the probability a player exceeds the line? |
A moneyline model may emphasize overall team strength, while a receiving-yard model may place more weight on target share, defensive coverage, and projected passing volume.
How Sportsbook Odds Add Market Context
Predicting the more likely winner and finding potential betting value are different tasks.
Suppose the model estimates:
Team A win probability: 58%
Then compare it with the sportsbook:
| Model Probability | Market-Implied Probability | Interpretation |
|---|---|---|
| 58% | 51% | Potential model-market difference |
| 58% | 56% | Small difference |
| 58% | 60% | Market price may be less attractive |
The team's underlying probability may remain unchanged while the value changes because the odds move.
This is why real-time sportsbook pricing matters.
Why AI Predictions Change During the Week
An NFL prediction on Monday may not be the same as the prediction on Sunday morning.
| New Information | Possible Model Adjustment |
|---|---|
| Injury report | Player availability |
| Practice status | Probability a player participates |
| QB announcement | Major offensive adjustment |
| Updated weather | Passing, kicking, totals |
| Confirmed inactives | Final lineup strength |
| Roster changes | Depth and usage |
| Market movement | Current price comparison |
Updating a prediction when the information changes is a feature of probabilistic modeling, not necessarily a sign of inconsistency.
Why AI NFL Predictions Can Be Wrong
NFL games still contain substantial uncertainty.
| Source of Uncertainty | Why It Matters |
|---|---|
| Turnovers | High impact and partly random |
| In-game injuries | Difficult to predict |
| Special teams | Can quickly change field position or score |
| Penalties | Can extend or erase drives |
| Explosive plays | A few plays can determine a game |
| Coaching adjustments | Teams can change strategy |
| Small samples | Early-season data may be noisy |
A 70% win probability still means there is a 30% probability of another result.
AI provides probabilities, not guarantees.
How to Evaluate an AI NFL Prediction Tool
A useful platform should provide enough context to understand its predictions.
| Feature | Why It Matters |
|---|---|
| Probability estimates | Shows model expectations |
| Current injury data | Reflects player availability |
| QB status | Captures a major NFL variable |
| Weather information | Adds environmental context |
| Advanced statistics | Improves performance analysis |
| Odds timestamps | Confirms market data is current |
| Confidence and risk | Communicates uncertainty |
| Historical performance | Helps evaluate results |
| Transparent methodology | Explains how the model works |
| Live vs. backtested results | Enables more meaningful evaluation |
A simple “Team A will win” message provides much less information than a probability supported by relevant context.
How SprtGenie Supports NFL Research
SprtGenie is designed to help users research NFL games using AI-powered analysis and sportsbook information.
| SprtGenie Capability | Research Use |
|---|---|
| AI NFL predictions | Provides probability-based analysis |
| Real-time odds | Adds current market pricing |
| Confidence scores | Adds model context |
| Risk information | Highlights uncertainty |
| Matchup analysis | Helps compare team strengths and weaknesses |
| Live analysis | Supports research as conditions change |
| SnapTap | Provides fast sports analysis |
| Genie Tap | Supports AI-powered research |
The platform should be treated as a research and decision-support tool rather than a guarantee of winning outcomes.
Simple AI NFL Analysis Workflow
| Step | What to Review |
|---|---|
| 1 | Offensive and defensive efficiency |
| 2 | Quarterback performance |
| 3 | Offensive line vs. pass rush |
| 4 | Receivers vs. secondary |
| 5 | Run game vs. run defense |
| 6 | Injuries and replacements |
| 7 | Weather |
| 8 | Rest, travel, and venue |
| 9 | Coaching tendencies |
| 10 | Expected game script |
| 11 | AI probability |
| 12 | Current sportsbook odds |
The goal is not to find one perfect statistic. It is to combine the most relevant information into a more complete view of the game.
Final Thoughts
AI NFL analysis works best when it combines multiple layers of information:
Team efficiency + quarterback play + positional matchups + injuries + weather + schedule + coaching + advanced statistics + market context
Advanced metrics help measure team quality. Matchups identify specific advantages. Injuries change expected personnel strength. Weather and scheduling add context. Sportsbook prices show how the market currently values the same game.
AI can process these signals consistently and convert them into probability estimates.
But NFL games remain uncertain because turnovers, penalties, injuries, special teams, and individual plays can rapidly change an outcome.
The most useful way to view AI NFL predictions is therefore as probability-based research—not guaranteed forecasts.
Frequently Asked Questions
| Question | Answer |
|---|---|
| How does AI predict NFL games? | AI combines team efficiency, QB performance, positional matchups, injuries, weather, rest, coaching, and other data to estimate probabilities. |
| What NFL statistics are useful for AI predictions? | EPA/play, success rate, CPOE, pressure rate, sack rate, explosive plays, red-zone efficiency, and other advanced metrics can be useful inputs. |
| How much do injuries affect NFL predictions? | It depends on the player's position, role, replacement quality, and matchup. Quarterback injuries often have particularly large effects. |
| Does weather affect NFL predictions? | Yes. Wind, rain, snow, temperature, and field conditions may affect passing, kicking, ball security, and scoring. |
| What is EPA in football? | Expected Points Added estimates how much a play increases or decreases a team's expected scoring position. |
| Can AI predict NFL spreads and totals? | AI models can estimate expected scoring margins and points, which can be compared with spread and total markets. |
| How does AI analyze NFL player props? | Models may combine expected volume, snap share, target share, red-zone usage, opponent matchup, injuries, and projected game script. |
| Are AI NFL predictions guaranteed? | No. They are probability estimates, and NFL outcomes still include significant uncertainty. |