
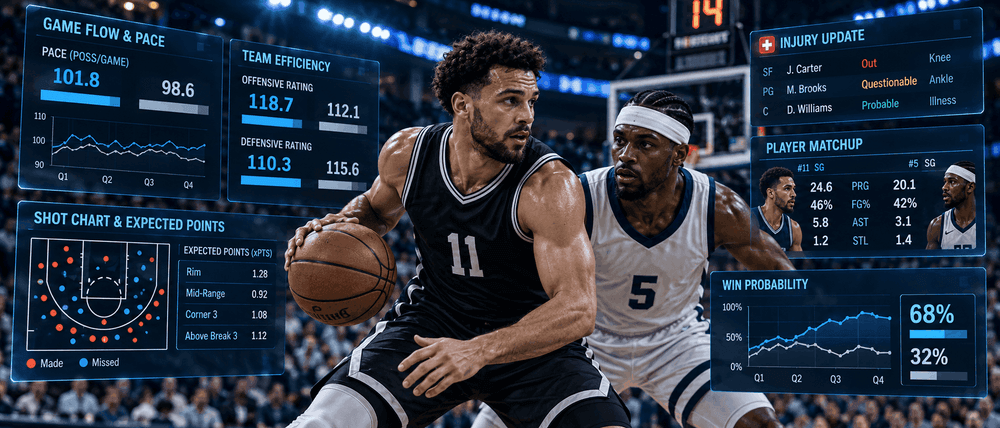
How AI Analyzes NBA Games: Pace, Efficiency, Injuries, and Player Matchups
NBA outcomes depend on more than win-loss records. Game tempo, possession efficiency, player availability, and tactical matchups all influence scoring and results. AI NBA predictions bring those factors into one statistical framework to estimate likely outcomes and, importantly, the uncertainty around them.
For NBA betting analytics, a strong forecast is not automatically a favorable wager. The estimated probability also needs to be compared with the market price. Here is how an NBA prediction model can make those assessments.
How AI NBA Prediction Models Work
Models combine historical game data with current information, then estimate scores, margins, or win probabilities. They can use regression, rating systems, simulation, or machine learning; greater complexity does not necessarily mean greater accuracy.
| Input | What it contributes |
|---|---|
| Pace | Expected number of possessions |
| Offensive / defensive efficiency | Scoring and prevention per possession |
| Injuries and rotations | Likely minutes and player contributions |
| Player matchups | Style-specific strengths and weaknesses |
| Rest and travel | Scheduling context |
| Sportsbook odds | A market benchmark, not proof of accuracy |
Typical Modeling Process
- Collect and clean historical team, player, and schedule data.
- Calculate opponent-adjusted efficiency and expected pace.
- Update inputs for confirmed injuries, likely rotations, and rest.
- Estimate outcome distributions and win or cover probabilities.
- Compare estimates against available odds and test predictions on unseen games.
Four Factors That Shape NBA Game Predictions
1. Pace: How Many Possessions Will the Game Have?
Pace measures possessions per 48 minutes. Faster teams create more scoring opportunities, but a fast pace does not guarantee a high-scoring game. An AI model estimates the likely tempo when two different styles meet and combines that pace with expected points per possession.
2. Offensive and Defensive Efficiency
Offensive Rating measures points scored per 100 possessions; Defensive Rating measures points allowed per 100 possessions. Net Rating is the difference. These metrics are more informative than raw points per game because they adjust for playing speed.
| Illustrative metric | Team A | Team B |
|---|---|---|
| Pace | 101 | 98 |
| Offensive Rating | 118 | 113 |
| Defensive Rating | 112 | 110 |
| Net Rating | +6 | +3 |
Team A has the stronger offense and net rating, while Team B allows fewer points per 100 possessions. Models also consider effective field goal percentage, turnovers, offensive rebounding, and free throw rate to explain why teams perform as they do. Values above are hypothetical.
3. Injuries and Expected Lineups
An unavailable high-usage player can change shooting opportunities, creation, spacing, defense, and playing time for teammates. Models should adjust for expected replacement minutes and lineup combinations rather than simply subtracting the injured player’s scoring average.
- Check whether a player is out, questionable, or expected to play.
- Estimate the minutes and responsibilities of replacements.
- Update team offense, defense, and pace assumptions when justified.
- Recalculate forecasts after meaningful lineup news.
4. Player Matchups and Game Context
Matchup analysis considers perimeter shooting versus closeouts, interior scoring versus rim protection, rebounding, and likely defensive assignments. Small head-to-head samples can be misleading, so they should be blended with broader player data. Home court, travel, rest days, back-to-backs, and projected workloads provide additional context.
From Model Predictions to NBA Betting Analytics
Expected Scores, Spreads, and Totals
A basic scoring estimate is: expected points = expected possessions × expected points per possession. Suppose a model projects 100 possessions, with 1.16 points per possession for Team A and 1.11 for Team B. The illustrative projected score is 116–111, implying a five-point average margin and a 227-point total.
A serious model does not stop at a single score. It estimates a range of outcomes and uses that distribution to calculate win probabilities, point-spread cover probabilities, and over/under probabilities. Shooting variance, foul trouble, and overtime create uncertainty.
Comparing Forecasts With Market Odds
American odds can be converted into implied probabilities. For positive odds: 100 / (odds + 100). For negative odds: absolute odds / (absolute odds + 100). At +120, the implied break-even probability is about 45.45%. If a model estimates 50%, the difference is theoretical and depends entirely on model accuracy; it is not a guarantee of profit.
How to Judge a Prediction Model
- Check calibration: outcomes assigned 60% probability should occur roughly 60% of the time over a substantial sample.
- Use out-of-sample testing and proper time ordering to avoid data leakage.
- Track log loss or Brier score, not just the percentage of winners picked.
- Monitor performance after injuries, trades, lineup shifts, or changes in team strategy.
- Treat confidence ratings as estimates, not promises.
Using SprtGenie for Basketball Research
SprtGenie focuses on data-driven sports prediction research and probability-based analysis. Readers can use its published tools and explanations to compare statistical forecasts with available odds, while independently verifying current lineup news and the model information presented. Explore https://sprtgenie.com/.
Conclusion
AI NBA predictions combine pace, efficiency, injuries, and matchup context into probability estimates. Their value comes from disciplined data quality, uncertainty measurement, and meaningful evaluation—not certainty about any single game. Use NBA betting analytics as a research aid and set clear financial limits.
Frequently Asked Questions About AI NBA Predictions - FAQ:
How does AI predict NBA games?
It processes historical and current basketball data to estimate scoring, margins, and probabilities using statistical or machine-learning models.
What matters most in an NBA prediction model?
Pace, offensive and defensive efficiency, injuries, rotation expectations, and opponent-specific matchups are central inputs.
Why is pace important for NBA totals?
It estimates the number of possessions, which helps determine the number of scoring opportunities when combined with efficiency.
How do injuries change NBA forecasts?
They affect expected minutes, shot creation, defensive assignments, and replacement lineups; current injury status matters.
Can AI predict point spreads accurately?
Models can estimate cover probabilities, but their reliability must be validated over many out-of-sample games.
Are AI NBA predictions guaranteed?
No. Game-level uncertainty, incorrect inputs, and model error mean any forecast can be wrong.
What is the difference between prediction and betting analytics?
A prediction estimates an outcome; betting analytics compares that estimate with odds and the risks around it.
How should bettors compare model probabilities and odds?
Convert odds to implied probability, account for market margin, and evaluate whether a well-tested estimate genuinely differs.
Sources for definitions and further reading: NBA.com/stats (pace and advanced team metrics); NBA glossary of statistical terms; https://sprtgenie.com/.
Editorial note: All numerical examples are illustrative. Predictions are uncertain and do not guarantee betting outcomes. Gambling involves financial risk; adults only, subject to local law.