
Expected Value vs. Win Probability: What’s the Difference in Sports Betting?
Understand expected value vs probability, calculate sports betting EV, and learn why a high win probability may still come with a poor price.
Expected Value vs. Win Probability: What’s the Difference in Sports Betting?
A selection can be more likely to win and still offer a poor price. That distinction is central to expected value vs probability. Win probability estimates how often an outcome might occur under comparable conditions. Expected value evaluates the average net result when both that probability and the offered payout are considered. With EV betting explained through straightforward examples, a 55% proposition can look favorable at even money yet unattractive at a shorter price. This guide connects win probability sports betting estimates with implied probability, bookmaker margins, uncertainty, and the limits of individual outcomes. None of the examples below represents a current sportsbook quotation or a verified prediction.
Win Probability and Expected Value Are Different Metrics
What Win Probability Measures
Win probability is an estimate of how often an outcome would occur if comparable situations could be observed repeatedly. A 70% forecast suggests more wins than losses in the long run, but the particular game may still go the other way. Models, market prices and subjective assessments may offer different probabilities; none reveals the future with certainty.
What Expected Value Measures
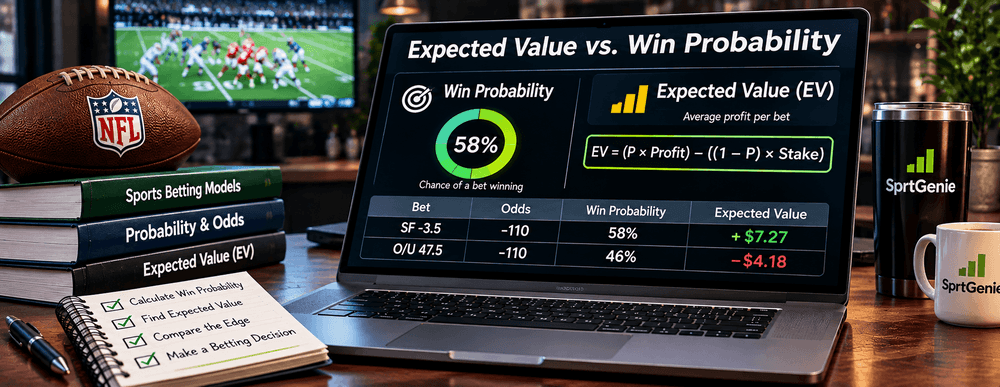
Expected value instead considers money. Let p be the probability of winning, W the net profit if successful, and S the stake. Then EV = p × W − (1 − p) × S. A positive model-based EV means the estimated average net return is above zero across comparable decisions, not that an individual bet is likely to win or pay a specific amount.
Why the Better Team Is Not Always the Better Price
Consider a favorite with an estimated 70% chance of winning at -300. A $100 stake wins $33.33 net or loses $100; estimated EV is 0.70 × 33.33 − 0.30 × 100 ≈ -$6.67. A less likely outcome can offer a better mathematical price if its payout is proportionately larger. The 'better team' and 'better-priced selection' answer different questions.
EV Betting Explained With Formulas and Examples
Expected Value Formula
For a 55% estimated chance at even-money odds (+100), a $100 stake wins $100 net on success and loses $100 otherwise. EV = 0.55 × 100 − 0.45 × 100 = +$10. The outcome remains uncertain; this positive figure summarizes the model's average net projection, not a guaranteed $10 payment.
Positive and Negative EV at the Same Win Rate
Keep the same estimated 55% chance but change the offered price to -130. A win now earns $76.92 net on $100, so EV = 0.55 × 76.92 − 0.45 × 100 ≈ -$2.69. Probability did not change; price did. This is the clearest demonstration of why a strong predicted winner can be a poor-value selection.
Implied Probability and the Break-Even Threshold
Implied probability is the break-even percentage encoded in odds. A -110 offer implies 52.38%, so a calibrated estimate above that threshold may indicate an apparent edge. But the reliability of the estimated probability is decisive. The separate SprtGenie implied-probability guide explains conversion arithmetic in full.
Why EV Is an Estimate
Expected value is sensitive to errors. If a model estimates 55% but the true chance is only 50%, the +100 example's true EV would be zero, not +$10. Model calibration, stale prices, omitted vig, and correlated predictions can all distort a calculated advantage. A precise-looking EV number should not be mistaken for a precise forecast.
Worked Example and Reference Tables
| Metric | What it asks | Measurement |
|---|---|---|
| Win probability | How likely is the outcome? | Estimated percent |
| Implied probability | What is break-even at this price? | Price conversion |
| Expected value | What is average net payoff? | Currency / stake |
| ROI | What was realized net return? | Net profit / stakes |
| Hypothetical chance | Offered odds | EV on $100 |
|---|---|---|
| 55% | +100 | +$10.00 |
| 55% | -130 | -$2.69 |
| 70% | -300 | -$6.67 |
| 45% | +150 | +$12.50 |
Evaluating Betting Markets With Probability
Favorite Versus Underdog Comparison
A hypothetical 70% favorite at -300 has negative model-based EV, as calculated above. A 45% underdog at +150 has EV = 0.45 × $150 − 0.55 × $100 = +$12.50 on a $100 stake. These two examples show how payout and probability combine. The underdog remains more likely to lose the individual event.
Comparing Prices Across Sportsbooks
At unchanged 55% model probability, +100 offers estimated EV of +$10 per $100, while -105 offers approximately +$7.38 because a win earns $95.24 net. Line shopping changes payout rather than the underlying event likelihood. Compare equivalent markets and confirm availability; a different spread or total is not the same proposition.
Variance and Short-Run Outcomes
Even a genuinely positive expected value strategy can experience losing streaks. Variance describes how realized results fluctuate around the expectation, and limited samples provide noisy evidence. Avoid inferring certainty from a few outcomes or assuming a losing streak must end on the next event. Risk does not vanish simply because arithmetic looks favorable.
How to Use SprtGenie as a Research Tool
Compare Model Estimates With Available Prices
SprtGenie can help readers view model-based probabilities alongside offered sportsbook prices. Before calculating a difference, confirm the market, threshold and timing match. Record the original forecast and quote; a changed price can overturn an earlier estimate. The platform supplies research inputs, not a direct measurement of the true likelihood.
Inspect Public Results and Uncertainty
A public track record is helpful when it shows graded outcomes, odds, sample sizes and realized ROI rather than just highlights. Probability calibration is especially relevant: forecasts near 60% should materialize at about that rate over a large representative group if they are reliable. Past performance does not guarantee future results.
Responsible Decisions and Common Misinterpretations
Use EV and win probability as separate questions: “How likely?” and “At what price?” Do not confuse hit rate with return, confidence with certainty, or positive estimated EV with assured profit. Sports betting can result in financial loss; research is for adults 18+ and should be accompanied by firm personal spending limits.
A sound estimate of win probability is necessary for meaningful EV calculations. Even then, uncertainty and payout variability mean a favorable estimate is not an assured result.
Practical Case Study
Imagine two fictional models both estimate a 60% chance that a team wins. At -200, a $100 win generates $50 net, so model-based EV is 0.60×50−0.40×100=−$10. At -125, the same $100 stake generates $80 net on success and EV is 0.60×80−0.40×100=+$8. Both wagers concern an identical outcome with the same modeled probability; the price alone changes the assessment. This calculation is illustrative and assumes the estimate is calibrated.
A practical way to stress-test EV is to change the model probability by two percentage points in either direction. At -125, 58% implies EV of 0.58×80−0.42×100=+$4.40; 62% implies +$11.60. Even small errors can materially change the conclusion near a break-even boundary. Compare several plausible scenarios, preserve the actual available odds, and evaluate model performance on records that include failed forecasts. Single-event outcomes do not validate expected value.
FAQ:
1. What is the difference between expected value vs probability?
Win probability asks how likely an outcome is; expected value asks what its average net payoff would be at a specified price and stake. The concepts are connected, but a high probability can accompany negative EV when the payout is insufficient.
2. What is win probability sports betting?
Win probability sports betting analysis expresses an estimated chance that a selection succeeds. It may come from a model or from quoted odds, which can include sportsbook margin. Neither is a guarantee about the next game.
3. How is EV betting explained mathematically?
For a stake S, estimated win probability p and net winning profit W, EV = pW − (1−p)S. EV betting explained this way makes the role of both chances and payouts explicit. The calculation is only as reliable as its probability input.
4. Can a high-probability bet have negative EV?
Yes. A hypothetical 70% chance at -300 produces about -$6.67 EV per $100 stake because wins earn only $33.33 while losses cost $100. The predicted favorite can be likely to win and still be unattractive at that price.
5. Can a low-probability outcome have positive EV?
Yes, mathematically. A hypothetical 45% chance at +150 gives estimated EV of +$12.50 on $100 staked. The selection is still more likely to lose than win, illustrating why price, not simply the favorite label, determines model-based EV.
6. How do sportsbook odds change expected value?
Odds determine the net profit if successful and the break-even win percentage. At a fixed 55% estimated chance, +100 yields +$10 EV per $100 stake, while -130 produces approximately -$2.69. The event probability is unchanged; only the offered price differs.
7. Does positive EV guarantee profit?
No. Even a truly positive expected value situation can lose repeatedly, because each outcome remains uncertain. A positive calculation based on an inaccurate model may not represent positive true EV at all. Risk and sampling variability remain important.
8. Is hit rate the same as ROI?
No. Hit rate counts winning selections, while ROI measures realized net return relative to total amount staked. A high hit rate at very short prices can produce losses. Both metrics should be reported alongside odds and sample sizes.
9. How reliable are AI probability estimates?
Reliability depends on data quality, model design, changing conditions and calibration on unseen observations. Compare predicted probabilities with actual frequencies across representative samples. A confident dashboard number is not evidence by itself that the estimate is accurate.
10. What should I compare before evaluating EV?
Check the exact selection, sportsbook threshold, currently available odds, implied break-even probability, model estimate, timestamp and uncertainty. Record the comparison before the outcome. Use responsible limits and avoid treating one attractive result as proof of a repeatable advantage.
SprtGenie provides research and analytics, not a sportsbook or a guarantee of outcomes. Sports betting involves financial risk. 18+; follow applicable laws and responsible-gambling safeguards.