
Expected Value vs. Win Probability: What’s the Difference in Sports Betting?
Learn expected value vs probability in sports betting, calculate EV from odds, and see why high win probability does not always mean a better price.
Expected Value vs. Win Probability: What’s the Difference in Sports Betting?
A prediction can be likely to win and still be a poor price. Another selection may be unlikely to win yet offer a more favorable theoretical return. Understanding expected value vs probability is how sports fans move beyond simply choosing favorites and begin evaluating what sportsbook odds actually mean.
Win probability sports betting analysis asks how often an outcome is expected to happen. Expected value (EV) asks what the average financial result would be if the same kind of decision were repeated at a given price. These two ideas are related, but they answer fundamentally different questions. This guide offers EV betting explained with accessible calculations, NFL and NBA examples, and a practical way to compare model estimates with market prices. All odds and predictions below are hypothetical—not live recommendations.
Win Probability and Expected Value: Two Different Questions
What Does Win Probability Mean?
Win probability is an estimated chance, typically between 0% and 100%, that a particular result occurs. The result could be an NFL team winning, a basketball team covering a spread, a player exceeding a prop threshold, or a game finishing over its total. A 70% prediction means that in a large set of sufficiently comparable situations, the outcome would be expected approximately seven times in ten—if the estimate is well calibrated.
A forecast of 70% is not certainty. The event still has a 30% modeled chance of failing. Nor does it describe the price being offered. The price determines whether the potential return compensates for that chance of losing.
What Is Expected Value in Sports Betting?
Expected value is the probability-weighted average net result per decision. For a simple win-or-lose market with no push, EV = (estimated win probability × net profit if it wins) − (estimated loss probability × amount risked). A positive estimated EV means the payout would be attractive if the probability estimate were accurate; a negative EV means the offered price does not compensate for the modeled risk.
For example, with a $100 stake at +100 odds and a credible 55% win-probability estimate, the expected result is (0.55 × $100) − (0.45 × $100) = +$10 per $100 risked, or +10% expected ROI. Nothing in that calculation promises a $10 gain on an individual wager. A single outcome produces either a $100 profit or a $100 loss.
Win Probability, Implied Probability, and EV Compared
| Metric | The question it answers | Example |
|---|---|---|
| Model win probability | How likely is the outcome? | 55% |
| Sportsbook implied probability | What break-even rate does the offered price require? | 50% at +100 |
| Model edge | How far apart are those probabilities? | +5 percentage points |
| Estimated EV | What is the probability-weighted net result at this price? | +$10 per $100 staked |
A model edge is measured in percentage points, not profit percentage. When the implied price is 50% and the model projects 55%, the edge is five percentage points. The EV percentage depends on the actual payout structure.
How Betting Odds Change Expected Value
Convert American Odds Into Break-Even Probability
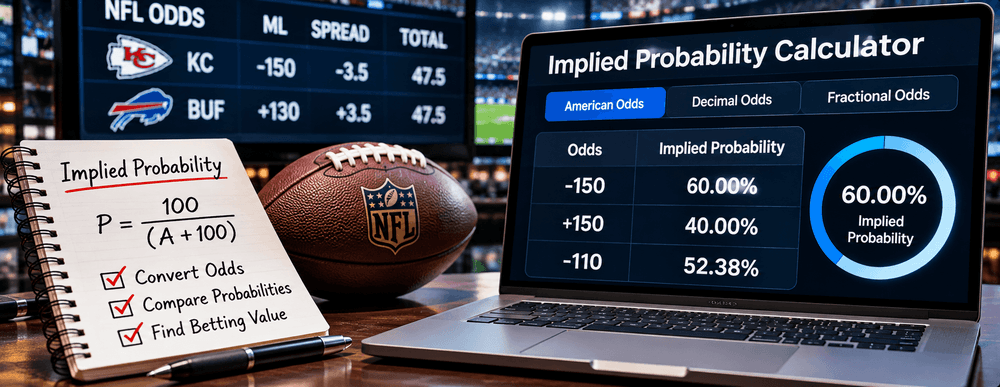
Sportsbook odds imply the win rate required to break even before accounting for taxes and other expenses. For positive American odds +A, implied probability = 100 ÷ (A + 100). For negative odds −A, implied probability = A ÷ (A + 100), where A is the absolute value. For decimal odds D, the formula is 1 ÷ D.
At +150, the implied probability is 100 ÷ 250 = 40%. At −150, it is 150 ÷ 250 = 60%. At −110, it is 110 ÷ 210 ≈ 52.38%. These are price-derived break-even rates—not independent estimates of a team’s actual chances. The sportsbook margin is usually included in the quoted prices.
The Same 55% Forecast at Three Different Prices
Assume an AI model estimates a selection at 55% and the bettor considers the same $100 stake at three different books. A better payout improves estimated EV without changing the underlying prediction.
| Available odds | Net profit if successful | Break-even probability | Estimated EV on $100 |
|---|---|---|---|
| −120 | $83.33 | 54.55% | +$0.83 |
| −110 | $90.91 | 52.38% | +$5.00 |
| +100 | $100.00 | 50.00% | +$10.00 |
At −120, EV is (0.55 × $83.33) − (0.45 × $100) ≈ +$0.83. At −110, it is approximately +$5.00; at +100, +$10.00. A tiny change in the reliability of the assumed 55% forecast could erase the estimated advantage at −120. This is why checking both price and estimation uncertainty matters.
Why a Heavy Favorite May Be a Negative-EV Selection
Suppose Team A is given an 80% chance of winning but is offered at −500. These odds imply an 83.33% break-even probability. A $100 stake would return only $20 in net profit if successful. Its estimated EV becomes (0.80 × $20) − (0.20 × $100) = −$4. The predicted winner is clear, but the available price appears unfavorable under the assumed model.
Why an Underdog May Have Positive Estimated EV
Team B might have only a 38% modeled chance at +200, which implies a 33.33% break-even rate. At $100 risked, EV is (0.38 × $200) − (0.62 × $100) = +$14. That positive estimate still involves a modeled 62% chance of losing the stake. Higher theoretical value does not mean higher likelihood of success or lower volatility.
| Hypothetical market | Model chance | Sportsbook odds | Estimated EV / $100 |
|---|---|---|---|
| Favorite | 80% | −500 | −$4 |
| Underdog | 38% | +200 | +$14 |
EV Betting Explained Across Common Sports Markets
NFL Moneylines and Point Spreads
Moneylines describe a straightforward win-loss outcome, while spreads require a team to cover a specific margin. An AI NFL model may assign a team a 68% chance of winning outright but only a 49% chance of covering −7.5. Those are different events, and each must be compared with its corresponding market price. Different spread numbers should never be treated as identical bets.
At whole-number spreads, an exact margin may produce a push and return the stake. The simple binary EV equation must then be expanded to include win, loss, and push probabilities. With no fees and a full refund on pushes, EV equals win probability times net win profit minus loss probability times stake; the push contributes zero net result.
NBA Totals and Player Props
Basketball totals depend on pace, minutes, rotations, efficiency, and the scoring distribution. Player-prop analysis also needs the specific threshold and settlement conditions. A player projected for 27 points is not automatically more likely than not to exceed 26.5 unless the model accounts for variability around the projection.
A model might estimate a 56% chance of over 26.5 points at −115. The implied break-even rate is 115 ÷ 215 ≈ 53.49%. That suggests a potential advantage—but only if the 56% model estimate is accurate, current, and relevant to the actual listed market.
Parlays, Correlation, and Compounded Uncertainty
Parlay success requires every leg to win. When legs are statistically independent, the combined probability can be found by multiplying individual probabilities. Two independent 60% events have a 36% joint chance. However, same-game outcomes can be correlated: a quarterback’s passing volume may influence the receiving opportunities of a teammate. Multiplying the legs as though they were independent can seriously misstate the joint probability and estimated EV.
Sportsbooks also adjust same-game parlay payouts for correlation. A parlay with apparently attractive individual selections is not automatically an attractive combined price. The full joint distribution and available combined odds matter.
Why Positive EV Is Not a Profit Guarantee
Even a well-calibrated model may experience extended losing stretches because sports outcomes are variable. EV describes a statistical average over repeated comparable opportunities, while actual results are path-dependent. The variance of outcomes, bet sizing, number of observations, changing conditions, and possible model error can all drive realized results far below the estimate.
A false assumption about player availability, stale odds, or a model trained on a biased sample can turn a projected +EV selection into a genuinely unfavorable one. Avoid interpreting a spreadsheet result as a factual edge without testing the underlying probabilities.
Using AI Sports Analytics to Compare EV With Win Probability
A Practical Research Workflow
- Choose the exact market and record the sportsbook odds, spread or total threshold, and timestamp.
- Convert the quoted odds to their implied break-even probability.
- Review the AI-estimated probability and relevant context, including injuries, lineups, and current conditions.
- Compare the model probability with the price; note the gap in percentage points.
- Calculate estimated EV using the actual net payout for a consistent hypothetical stake.
- Check the model’s calibration, sample size, and uncertainty for that sport and market.
- Compare equivalent prices across books, keeping the same settlement conditions.
- Record forecasts and subsequent results to evaluate whether the estimated edges held up.
How SprtGenie Fits Into the Analysis
SprtGenie positions itself as an AI sports research platform with model predictions, confidence and risk labels, price comparisons across 10 U.S. sportsbooks, and a publicly graded track record. Its SnapTap feature can identify a televised game from a photo or short clip and provide relevant match insights. These features can help users investigate a market, but the platform’s outputs remain estimates rather than guaranteed outcomes.
To evaluate the estimates responsibly, look beyond winning percentage. Check the public record for available odds, volume of predictions, realized ROI, and any methodology disclosures. A 60% hit rate may be unprofitable at expensive prices, while a lower hit rate can be consistent with favorable outcomes at larger prices. The specific underlying prices are essential.
Common Errors in Expected Value vs Probability Analysis
- Equating the most likely winner with the best price.
- Calling a high confidence score the same thing as a high win probability.
- Ignoring vig and assuming sportsbook implied probabilities sum to exactly 100%.
- Comparing outdated odds with a newly updated model probability.
- Treating an untested probability forecast as an accurate measure of truth.
- Ignoring pushes, void conditions, different thresholds, or parlay correlation.
- Assuming positive estimated EV means a particular selection will win.
SprtGenie is a research and analytics service, not a sportsbook. This content is educational, intended for adults 18+ where permitted by law, and does not guarantee results. Gambling can cause financial loss; do not treat forecasts as a reason to exceed personal limits.
FAQ:
What is the difference between expected value and win probability?
Win probability estimates how often an outcome may happen. Expected value also considers the offered payout and the amount at risk to estimate the average net result across comparable decisions.
Can a bet with a high win probability have negative EV?
Yes. An 80% favorite priced at odds that require an 83% break-even rate would have negative estimated EV if the 80% model probability were correct.
Can a low-probability outcome have positive expected value?
Yes. A 38% outcome offered at +200 has a lower implied probability of 33.33%. That price can create positive estimated EV under a reliable 38% forecast, despite its high chance of losing.
What is the formula for expected value in sports betting?
For a simple market without a push, EV equals win probability multiplied by net winning profit minus loss probability multiplied by the stake. Include any push or void cases where applicable.
How do I convert sportsbook odds into implied probability?
For positive American odds, divide 100 by odds plus 100. For negative odds, divide the absolute odds by that absolute number plus 100. Decimal odds imply a probability of one divided by the decimal price.
Is a positive model edge the same as positive expected value?
Not exactly. Model edge is the difference between modeled and implied probabilities in percentage points. EV expresses the expected financial effect after incorporating the payout and stake.
Does line shopping change win probability?
Comparing identical markets does not change the underlying event or its modeled probability. It can change the available payoff and therefore the estimated EV.
Do parlays have the same EV calculation as single wagers?
The same probability-weighted principle applies, but parlays require a properly estimated joint win probability. Same-game legs may be correlated, making simple multiplication misleading.
How does AI help estimate sports betting probabilities?
AI models can combine historical performance, matchup features, availability, and game context to forecast outcome distributions. The quality of those estimates depends on data, validation, updates, and calibration.
Does positive expected value guarantee long-term profits?
No. Outcomes are uncertain, estimated probabilities can be wrong, and actual returns may vary substantially. Historical evidence and disciplined risk awareness remain essential.